Motivation for running a marathon is varied and sometimes elusive. Each runner has a goal – to place, hit a PR or just finish standing up. The NYC Marathon is the ultimate collection of motivations – every level of athlete doing whatever it takes to hit that goal. We wanted to capture those stories through the lens of running data. … Read More
The Impact of Pace on Mechanics
One of the most frequent questions we hear is “How do I compare to other runners.” Answering that question is more complicated than you’d think. For two runs or runners you’d like to objectively compare, it’s important that the pace and terrain are identical, otherwise you might as well be comparing apples to oranges. Our bodies naturally adapt, and your … Read More
The Finish (NYC 2015)
The finish is where you dig deep, give it everything you’ve got, knowing that it will be over soon. In Ellie’s case, we see the picture of an elite athlete who is holding on as hard as she can, in spite of a loss of efficiency (Flight Ratio started at 25% – and dropped down to nearly 15% toware the finish). … Read More
The Wall (NYC 2015)

The Wall is every runner’s torment.When will I hit it? Will I recover? How? Even an elite, consistent runner like Ellie, isn’t impervious to The Wall. At around mile 21 (35k), Ellie’s pace drops slightly as her Flight Ratio (an efficiency indicator) continues its slow downward trend (it’s fortunate that Ellie starts at elite levels!). But what is interesting is … Read More
The Bridge (NYC 2015)
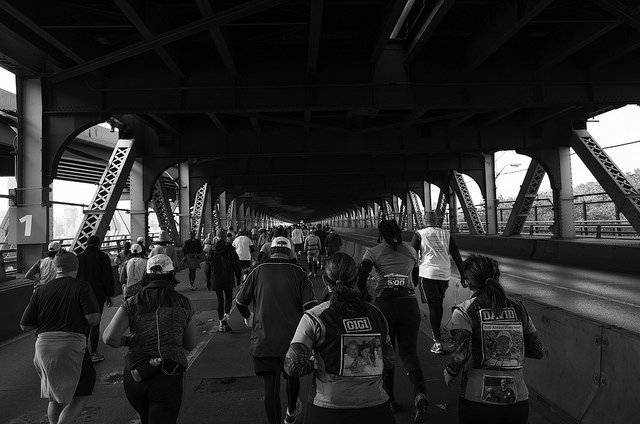
The Queensboro Bridge at mile 15 (25K) is considered one of the toughest points of the course, and with no spectators allowed on the bridge, it’s also the quietest. Our elite runner – Ellie – slows her pace just slightly as she shifts to a more mid/fore-foot strike going up and over the bridge. We can see that in both her higher … Read More
The Start (NYC 2015)
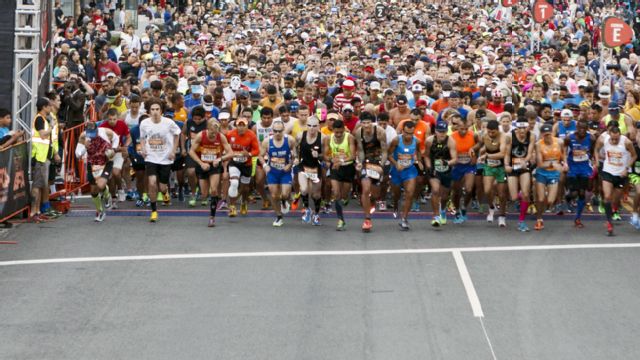
Ellie was a seeded runner, meaning she got to start of in an early wave. The advantage is that she was able to get off the line quickly. Although it’s clear from the variance we see in both her Footstrike Type and her Contact Time that she was weaving her way through the crowd in the first 5K of the … Read More
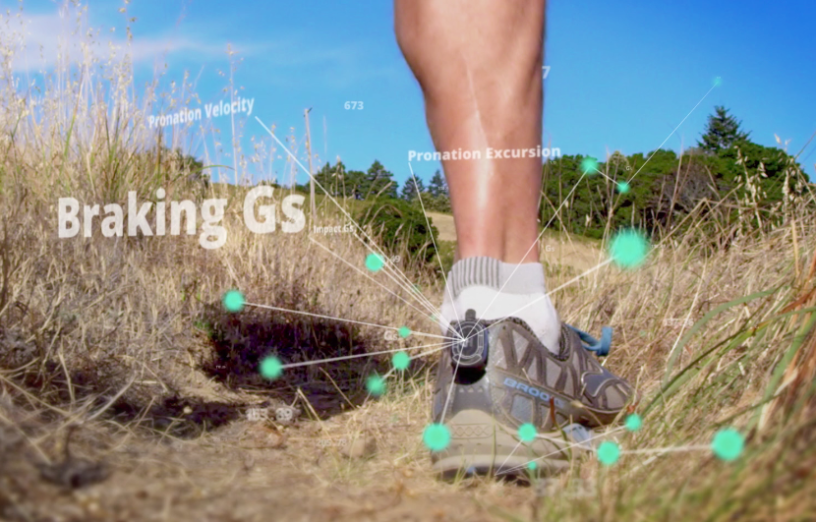
Pronation or Supination?
Q: Pronation or Supination – how to tell the difference with the data? – JxRx A: Pronation excursion (FS-MP) is the measure of how much roll the foot experiences between footstrike (FS) and the point of maximum pronation (MP). MP usually occurs before contact time is on average around 300ms. Similarly Pronation Excursion MP- Toe Off (TO) is the amount … Read More
Correlating pronation velocity and pronation excursion?
Q: One correlation I have noticed that is pretty consistent across all of my runs is the correlation between pronation velocity and pronation excursion…Overall my RS numbers were pretty symmetrical b/w my right and left foot (which is something that I’ve been thinking about lately – whether or not it’s beneficial to strive for symmetrical biomechanics b/w my left and … Read More
Differences In Ground Contact Time Explain the Less Efficient Running Economy in North African Runners
Research Paper The purpose of this study was to investigate the relationship between biomechanical variables and running economy in North African and European runners. Eight North African and 13 European male runners of the same athletic level ran 4-minute stages on a treadmill at varying set velocities. During the test, biomechanical variables such as ground contact time, swing time, stride … Read More
Extra-padded shoes may not blunt running injuries
A summary of research contradicting marketing claims that softer-soled shoes decrease the risk of running injury.