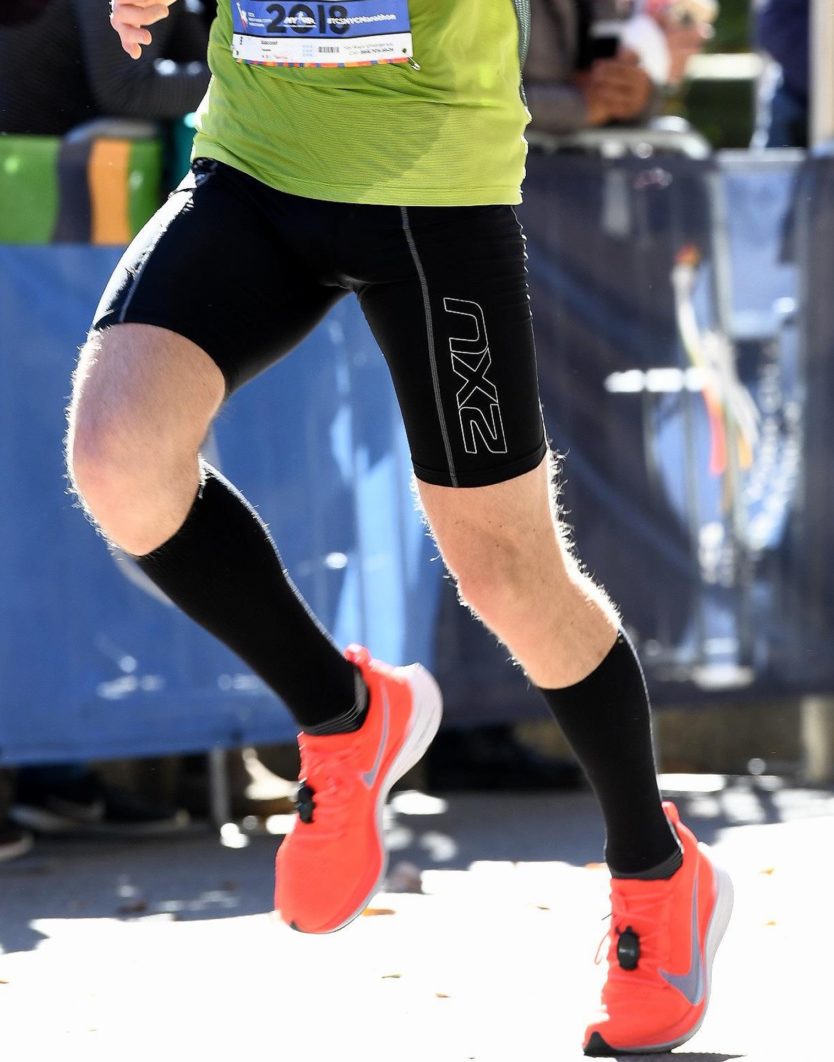
We were stoked to be back in NYC for the 2018 Marathon – getting pods out to over 50 runners to capture their data as they ran on what would turn out to be a perfect day in NYC! Positioning ourselves in Central Park at the Mile 25 marker, we watched (and waited), looking for pods while runners flew past … Read More
The Unescapable Fatigue Effect
In an earlier article, I discussed the mechanics of how fatigue impacts pace during a marathon, but what happens to other metrics like ground contact time, flight ratio and impact characteristics? We know these metrics are predictably affected by running speed in an unfatigued state. As running speed increases, impact Gs, pronation, pronation velocity and flight time usually increase. Contact time … Read More
Achieving Pace Consistency in Endurance Running
Pace consistency is at the heart of a runner’s training and is important for endurance races like the marathon. Coaches help athletes find their rhythm early as to not burn energy. Achieving pace consistency seems simple, but mechanically our bodies make constant and subtle adjustments. We know pace is a simple equation: Pace = Stride Length x Stride Rate. But … Read More
Deep Dive into the 2015 NYC Marathon
Motivation for running a marathon is varied and sometimes elusive. Each runner has a goal – to place, hit a PR or just finish standing up. The NYC Marathon is the ultimate collection of motivations – every level of athlete doing whatever it takes to hit that goal. We wanted to capture those stories through the lens of running data. … Read More
The Finish (NYC 2015)
The finish is where you dig deep, give it everything you’ve got, knowing that it will be over soon. In Ellie’s case, we see the picture of an elite athlete who is holding on as hard as she can, in spite of a loss of efficiency (Flight Ratio started at 25% – and dropped down to nearly 15% toware the finish). … Read More
The Wall (NYC 2015)
The Wall is every runner’s torment.When will I hit it? Will I recover? How? Even an elite, consistent runner like Ellie, isn’t impervious to The Wall. At around mile 21 (35k), Ellie’s pace drops slightly as her Flight Ratio (an efficiency indicator) continues its slow downward trend (it’s fortunate that Ellie starts at elite levels!). But what is interesting is … Read More
The Bridge (NYC 2015)
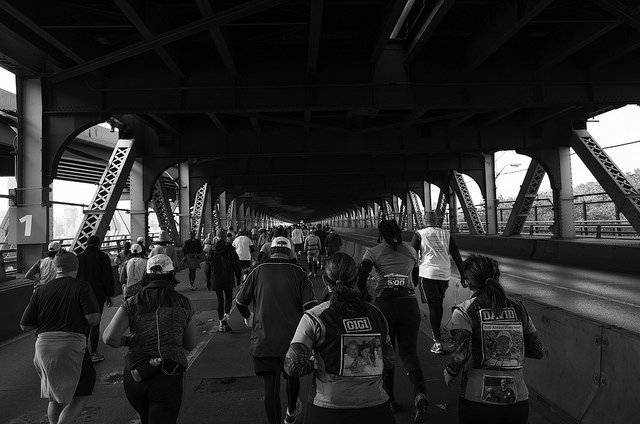
The Queensboro Bridge at mile 15 (25K) is considered one of the toughest points of the course, and with no spectators allowed on the bridge, it’s also the quietest. Our elite runner – Ellie – slows her pace just slightly as she shifts to a more mid/fore-foot strike going up and over the bridge. We can see that in both her higher … Read More
The Start (NYC 2015)
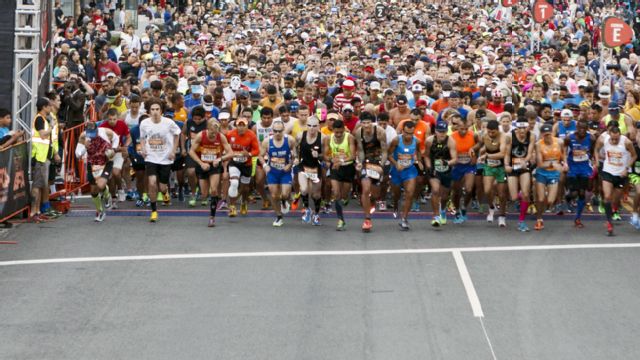
Ellie was a seeded runner, meaning she got to start of in an early wave. The advantage is that she was able to get off the line quickly. Although it’s clear from the variance we see in both her Footstrike Type and her Contact Time that she was weaving her way through the crowd in the first 5K of the … Read More
180 is Not a Magic Number
We’ve all heard that if you want to improve your running game, you should target a stride rate of 180 steps per minute. We’re not convinced. Our favorite example is our head of engineering. At 6’5” we’re pretty sure a 180 stride rate is a physical impossibility. We took a look at data we captured at the 2015 TCS NYC Marathon to look into … Read More
It Helps to Know How to Fly
Not a shocker but the more you fly, the faster you’ll finish a marathon. Flight ratio is an indicator of efficiency, so we were particularly interested to look at our data from the 2015 NYC Marathon to analyze breakdown of flight ratio over finish times. We discovered flight ratio is much more strongly correlated to finish times than the infamous 180 … Read More
- Page 1 of 2
- 1
- 2

