UNLV/RunScribe Study — Summer 2016
Purpose:
The primary purpose of the project was to compare RunScribe metrics with high speed video and motion capture data measurements over an expanded range of running speeds and fitness levels. A secondary purpose was to investigate possible relationships between RunScribe metrics and running economy.
Methods:
Subjects
Subjects: 23 runners. The runners represent a wide range of running performance and include a mixture of UNLV athletes, student recreational runners, and runners from the local triathlete and running community. The time commitment for the runner was approximately 1.5 hours (one day test) to complete the study.
Instruments
Equipment included an instrumented force treadmill (Bertec FIT), portable metabolic system (Cosmed K4b2), a 10-camera motion capture system (Vicon), and 4 RunScribe sensors. Kinetic and kinematic post processing was conducted using custom laboratory software (Visual3D and Matlab).
Procedures
Subjects were included in the study if they were currently running at least 10 km per week and had run at least a 5 km race in the past 6 months. Upon arrival, subjects completed a short running history survey and university approved informed consent form. Following completion of documentation, subjects were instructed to complete a 5-minute warm-up on the treadmill, serving as a warm-up and treadmill familiarization period. At the end of the 5-min warm-up period, subjects were asked to choose their preferred running speed (PRS) that would be representative of a 30 minute run on the treadmill. This speed was blind to the subject and were the average of 3 trials. Subjects were instrumented with a lower extremity cluster marker set(for the motion capture system), 4-RunScribe sensors and portable metabolic system. Subjects performed 3 speed conditions on the treadmill, with all systems collecting simultaneously. The three treadmill running speed conditions were PRS, plus 2 additional speeds as a function of their LT (Lactate Threshold) pace (90% & 80%). Conditions lasted upwards of 10 minutes per condition. Once the subject achieves steady state running, they ran for 5 more minutes. Motion capture occurred in 15 sec windows. The order of speed conditions was randomized across subjects.
Deliverables:
- Subject demographics
- 3D kinematic variables
- COM motion
- Stance time
- Stride angle data (from projectile motion)
- Kinetic variables
- Absorption/propulsion ratio
- Running economy
- LT pace
- Submax VO2 measurement at each speed condition
- RunScribe
- Per-FootStep metrics synced to other data collection times.
- Raw (200Hz) sensor data for each step.
- Per-FootStep metrics synced to other data collection times.
Results:
In this blog entry, we focus on the comparison between the laboratory gold standards of High Speed Video and Motion Capture, as they compare to metrics captured by RunScribe.
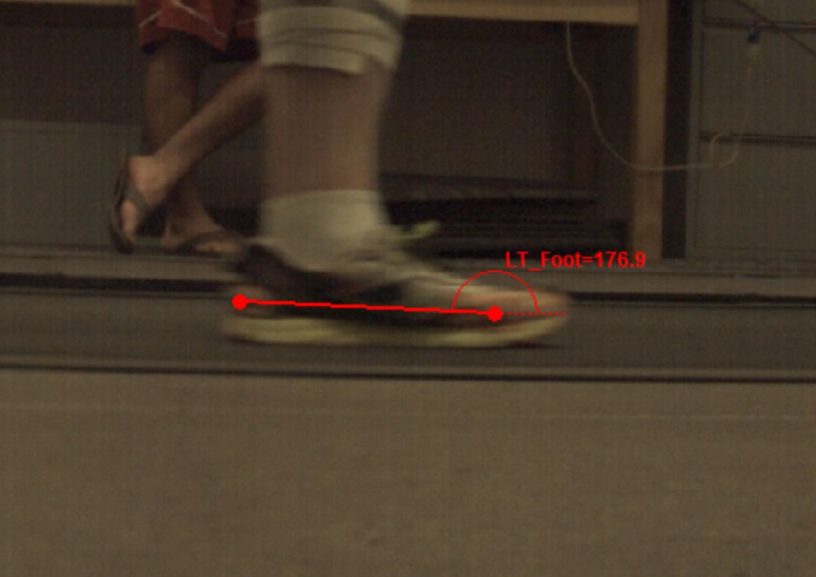
Here we see select frames captured by the high speed (128Hz) video system which have been manually digitised for the various gait events (foot-strike, foot-flat, and toe-off).
[table id=2 /]Ground Contact Time – High Speed Video vs Motion Capture

Ground contact time during running is defined as the time elapsed between initial ground contact and toe off. The gold standard in measuring ground contact time during running is high speed video, where heel strike and toe off are manually digitized to find the time elapsed. This system is limited for reasons including the time consuming process of manual digitization, as well as the restriction to recording on a treadmill or limited number of steps in the field.
In this plot, we compare the results of the high speed video digitization with the Vicon (10-camera) motion capture system. The solid line depicts a 1.0 correlation, with the two dashed lines showing +/- 25 ms ‘error bars’. The left and right side correlations (0.76 and 0.74 respectively) show strong (but not perfect) correlation, thus highlighting the variance in even the ‘gold standard’ systems of measurement.
Ground Contact Time – RunScribe vs High Speed Video

Here we see the RunScribe correlation in all 4 mounting locations (Left-Heel, Left-Laces, Right-Heel, Right-Laces) compared with the same High Speed Video data, with all configurations showing over 0.9 (very strong) correlation. Again, the solid line depicting a 1:1 correlation, and the dashed lines showing +/- 25 ms ‘error bars’.
Pronation Excursion – RunScribe vs Motion Capture

Here we compare the RunScribe Pronation FSMP metric with the Pronation measurements of the Motion Capture System, capturing data in all 4 mounting locations (Left-Heel, Left-Laces, Right-Heel, Right-Laces) Again, the solid line depicting a 1:1 correlation, and in this case the dashed lines showing +/- 2.5 deg ‘error bars’.
Discussion:
Both contact time and pronation excursion measured by RunScribe showed very good overall agreement to the gold standards of high speed video and motion capture. Correlation coefficients between both systems was high for all speeds measured, and in both mounting locations (All ICC > .75 p<0.01). Accuracy was not statistically dependent on foot or mounting location.
Possible limitations of this study include human error in manual digitization of footstrike and toe off, as these events can be difficult to pinpoint in a single frame, and the inaccuracies of automatic detection of these same gait events in the motion capture system (Vicon). Many gait labs use the automatic detection algorithm that come with their motion capture systems as the gold standard because of the very large time commitment to manual digitization. However, in recent years the use of auto detection of running and walking gait events has come under scrutiny because of the high variability in the results. In this study we assumed that the manually digitized data was the best representation of footstrike, foot flat, and toe off for all subjects. The auto detected gait events from the motion capture system correlated fairly well with the manually digitized data but not quite as well as the RunScribe data.
RunScribe was found to be a reliable and sensitive tool for detecting small differences in both contact time and pronation during treadmill running and can, by extension, allow for valid measurements of running in the field.
References:
- Maykut, Jennifer N. et al. “Concurrent validity and reliability of 2D kinematic analysis of frontal plan motion during running.” International Journal of Sports Physical Therapy 10.2 (2015): 136–146.
- Cuesta-Vargas A. The use of inertial sensors system for human motion analysis. Physical Therapy Reviews. 2010;15(6):462-473. doi: 10.1179/1743288X11Y.0000000006.
- Fong DT, Chan Y. The use of wearable inertial motion sensors in human lower limb biomechanics studies: A systematic review. Sensors (Basel, Switzerland). 2010;10(12):11556-11565. doi: 10.3390/s101211556.
- Purcell B, Channells J, James D, Barrett R. Use of accelerometers for detecting foot- ground contact time during running. . 2005:603615-603615-8.
- Boutaayamou M, Schwartz C, Stamatakis J, et al. Development and validation of an accelerometer-based method for quantifying gait events. Med Eng Phys. 2015;37(2):226-232.
- Sinclair J, Hobbs SJ, Protheroe L, Edmundson CJ, Greenhalgh A. Determination of gait events using an externally mounted shank accelerometer. Journal of applied biomechanics. 2013;29(1):118-122.
- Pearson correlation coefficient. https://en.wikipedia.org/wiki/Pearson_correlation_coefficient