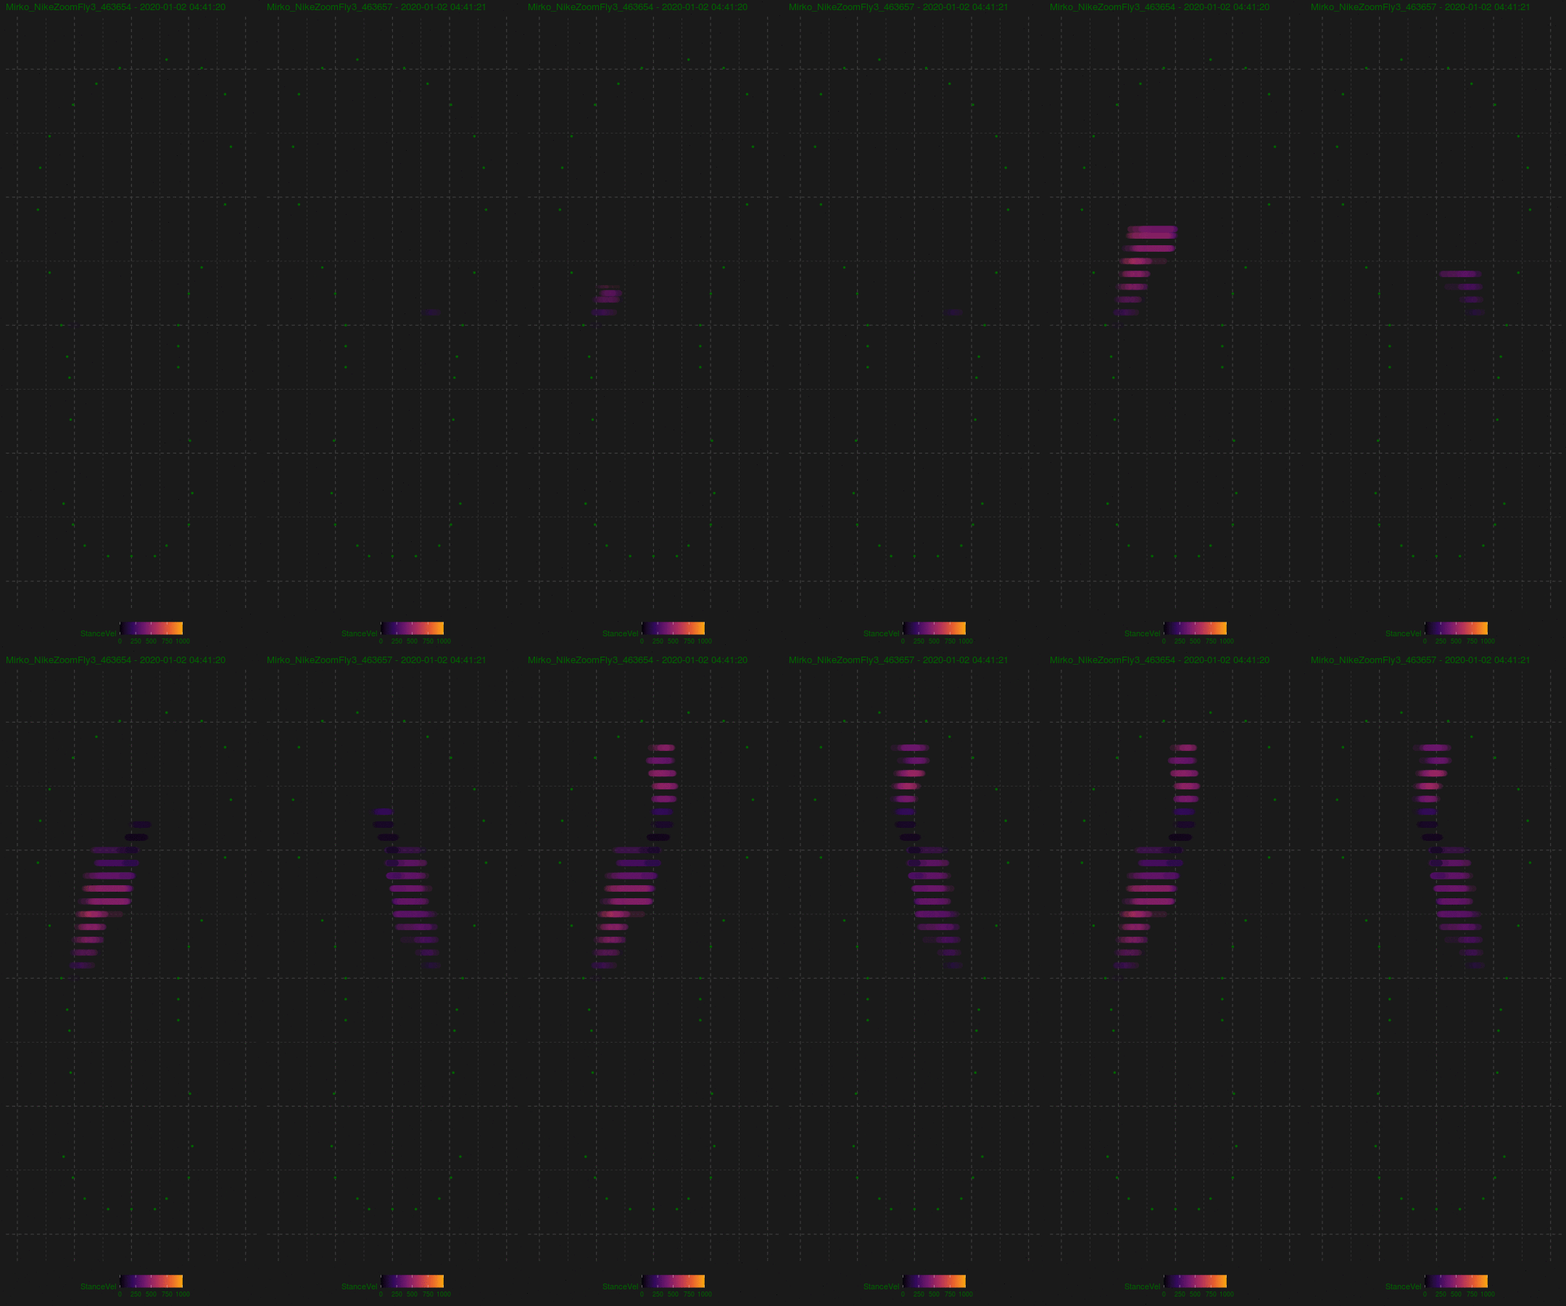
As a progression to the ShoePrint framework that we launched early last year, I’m excited to announce our new ShoeRide visualizations! Where ShoePrints allowed you to see where on your shoe you were landing and taking-off, our ShoeRides now show the entire ground contact progression, from foot strike to toe off and all points in-between. We capture the stance progression velocity as the ‘Ride’ has been shown to be correlated with how well that shoe is working with the particular biomechanics of the runner.
You can see ShoeRide in two graphical formats.

Our ShoeRide XY visualizations provide a 2D representation of how your ground contact maps to the bottom of the shoe. Each step within the selected step range is graphed, with the color representing the stance velocity at that location, allowing you to see just how smooth the transition is from initial to final contact in a single glance!

The combination StanceVelocity / vGRF plots let you see the progression versus ground contact time. I’ve experimented with a number of different GRF models (e.g. Clark, Komaris) but as with any model, they all have their limitations when compared to direct measurement (force plates, force plate treadmills). Instead, I’ve combined the simple (one mass) model to show the Peak Vertical Ground Reaction Force in units of body-weight, with the instantaneous StanceVelocity captured at every point from foot strike to toe off. I believe the combination has the potential to radically change the way we understand how we are moving in a given pair of shoes!
Happy Running!

